My goal is to investigate and discover the problems or possible improvements of different platforms. In order to improve the user experience.
I will focus on these case studies in three stages:
First, I present and analyze, without entering into judgments, the home page or other interface that is "critical" of the different platforms that I have chosen to analyze.
Secondly, a research with a more qualitative and evaluative approach (due to the limited resources I have).
Objectives: to identify the motivations, uses and experience of the users, for which I will conduct some interviews (Friends, family). Test the effectiveness of the interface and observe the user experience through user tests.
Analyze the architecture and reorganize the contents through Card Sorting, in a deeper way detect barriers and solutions by applying a heuristic analysis (Fitt's Law, Hick's Law, Serial Position Effect, Gestalt Laws, Donald Norman's Design Principles and finally Nielsen's Heuristic Principles and D. Pierotti's items).
Finally and with all the information, I will make a new design proposal in order to solve the possible problems detected and improve the user experience.
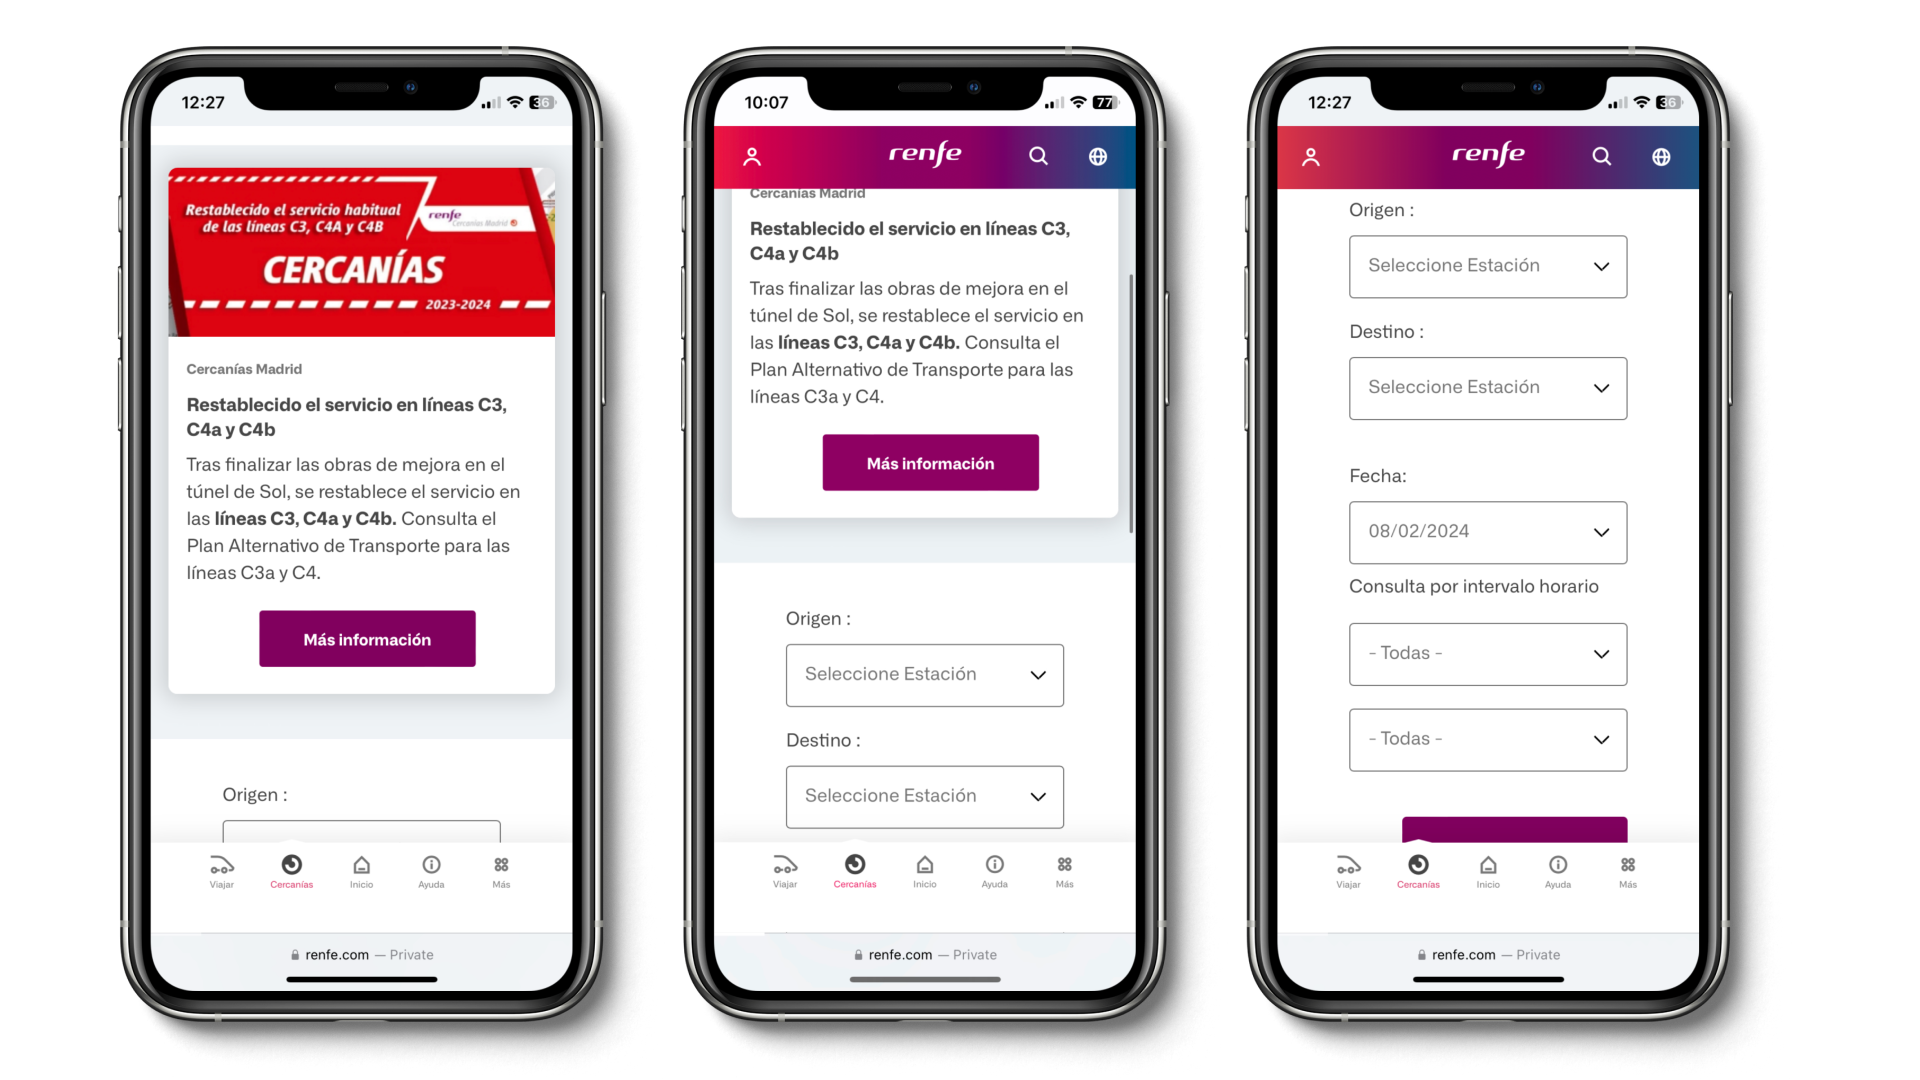
News information occupies a large part of the screen and its main function (train route search) is not displayed.Search contenders are not justified with consistent distances, the main button is lost in user visibility and lack of consistency.
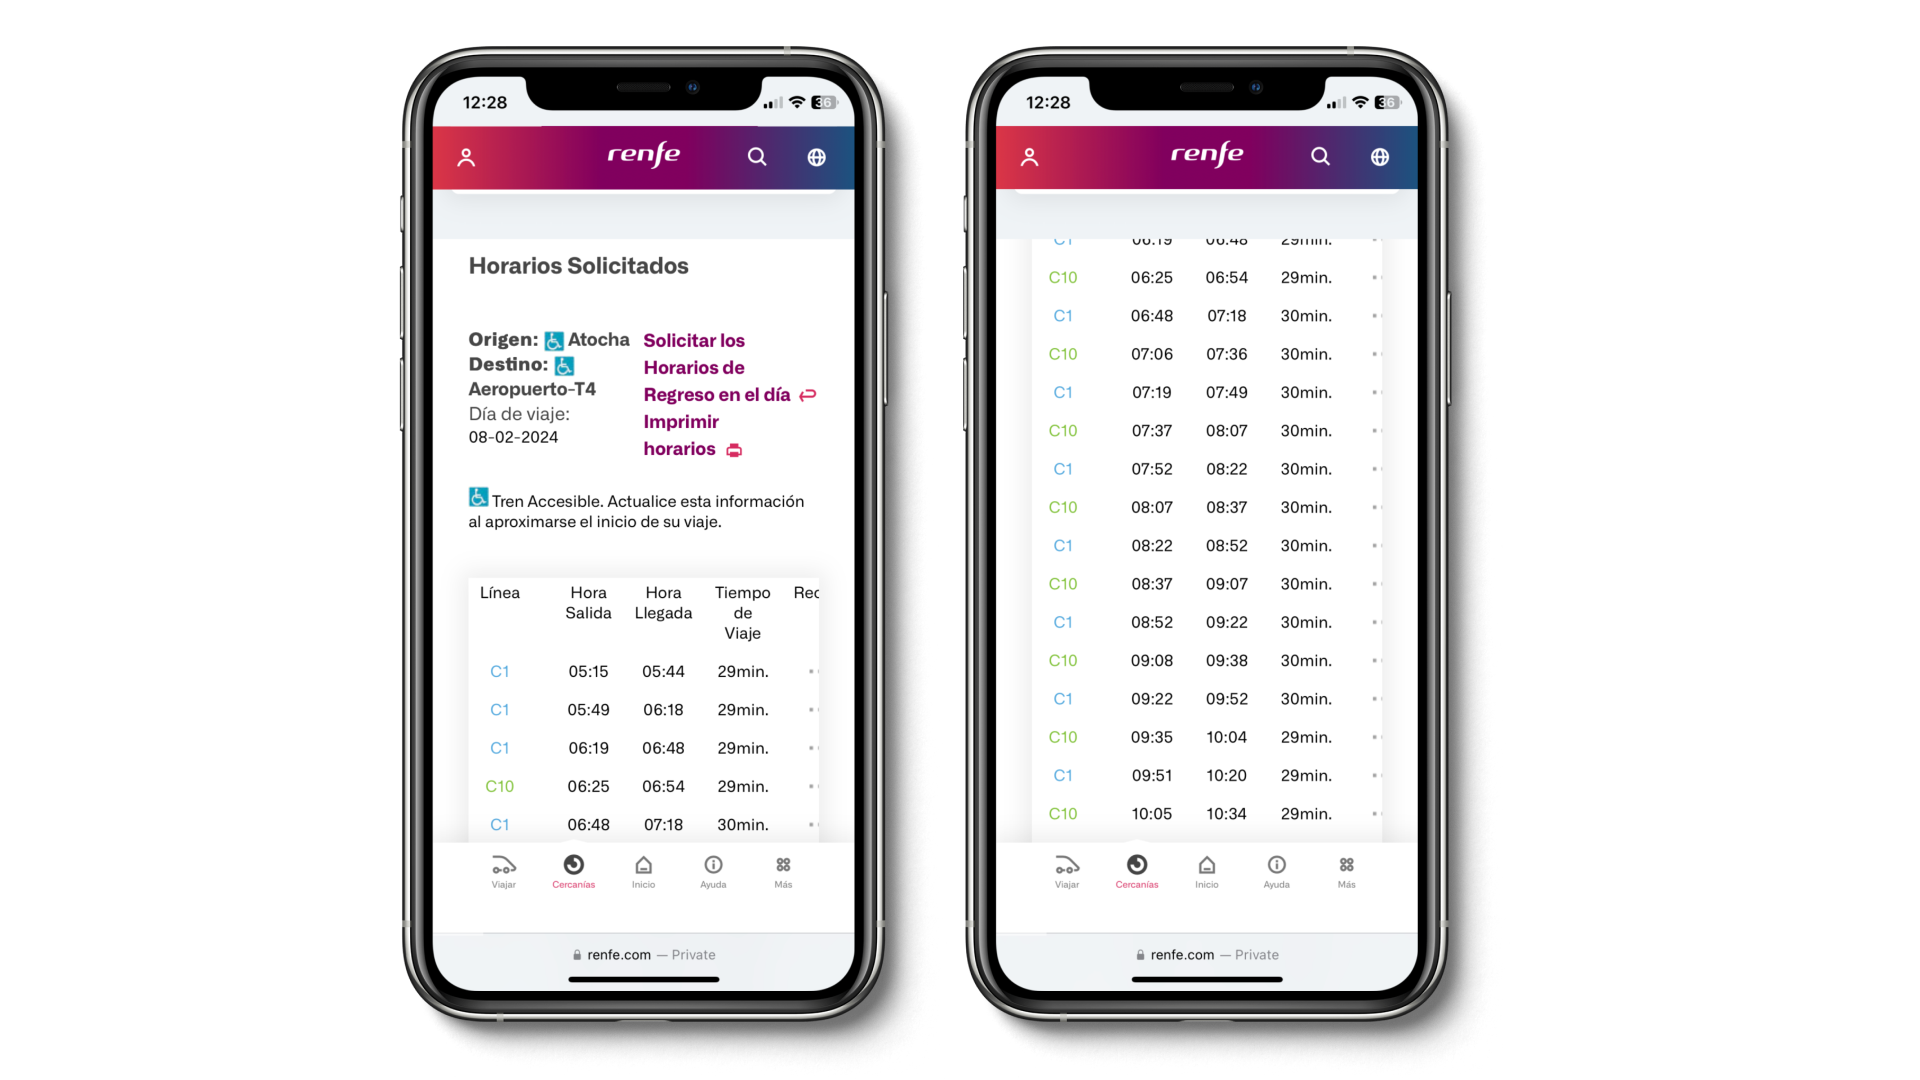
It is not intuitively visualized that you have the possibility to invert the origin and destination.The information of the trains is shown in a very unclear way, it does not have a fixed header so that the user does not know which column it is and its meaning.
My goal is to discover and identify who and how the users are, their needs and motivations, what kind of need the product is or isn't covering, why they use it, how they evaluate the product in terms of navigation, usability, etc.
What are the barriers and areas for improvement and how do they compare it with the competition.
Therefore I need to know the context of use of the product, the habits of the users, their values, perceptions, preferences, expectations, needs and motivations.
To know their current experience and vision of ideal experience, the enablers and barriers for a better experience and what are the trends in the market.
I was only able to interview eight people in person. The sample is divided into 65% men and 35% women. With an age range between 24-50 years old. All of them people with a stable employment situation and a middle social class.
Users don't like to waste time. When they want to search for a route to find out the train schedule.To know their current experience and vision of ideal experience, the enablers and barriers for a better experience and what are the trends in the market.
Users feel more comfortable traveling by train than by any other means of transportation.
75% of users use the Renfe web portal to search for train schedules.
What train users value most is: its punctuality and the fact that it makes fewer stops than the metro, saving more time.
The goal is to find areas of possible improvements to reduce as much as possible these frictions and make the user interface as clear and understandable as possible.
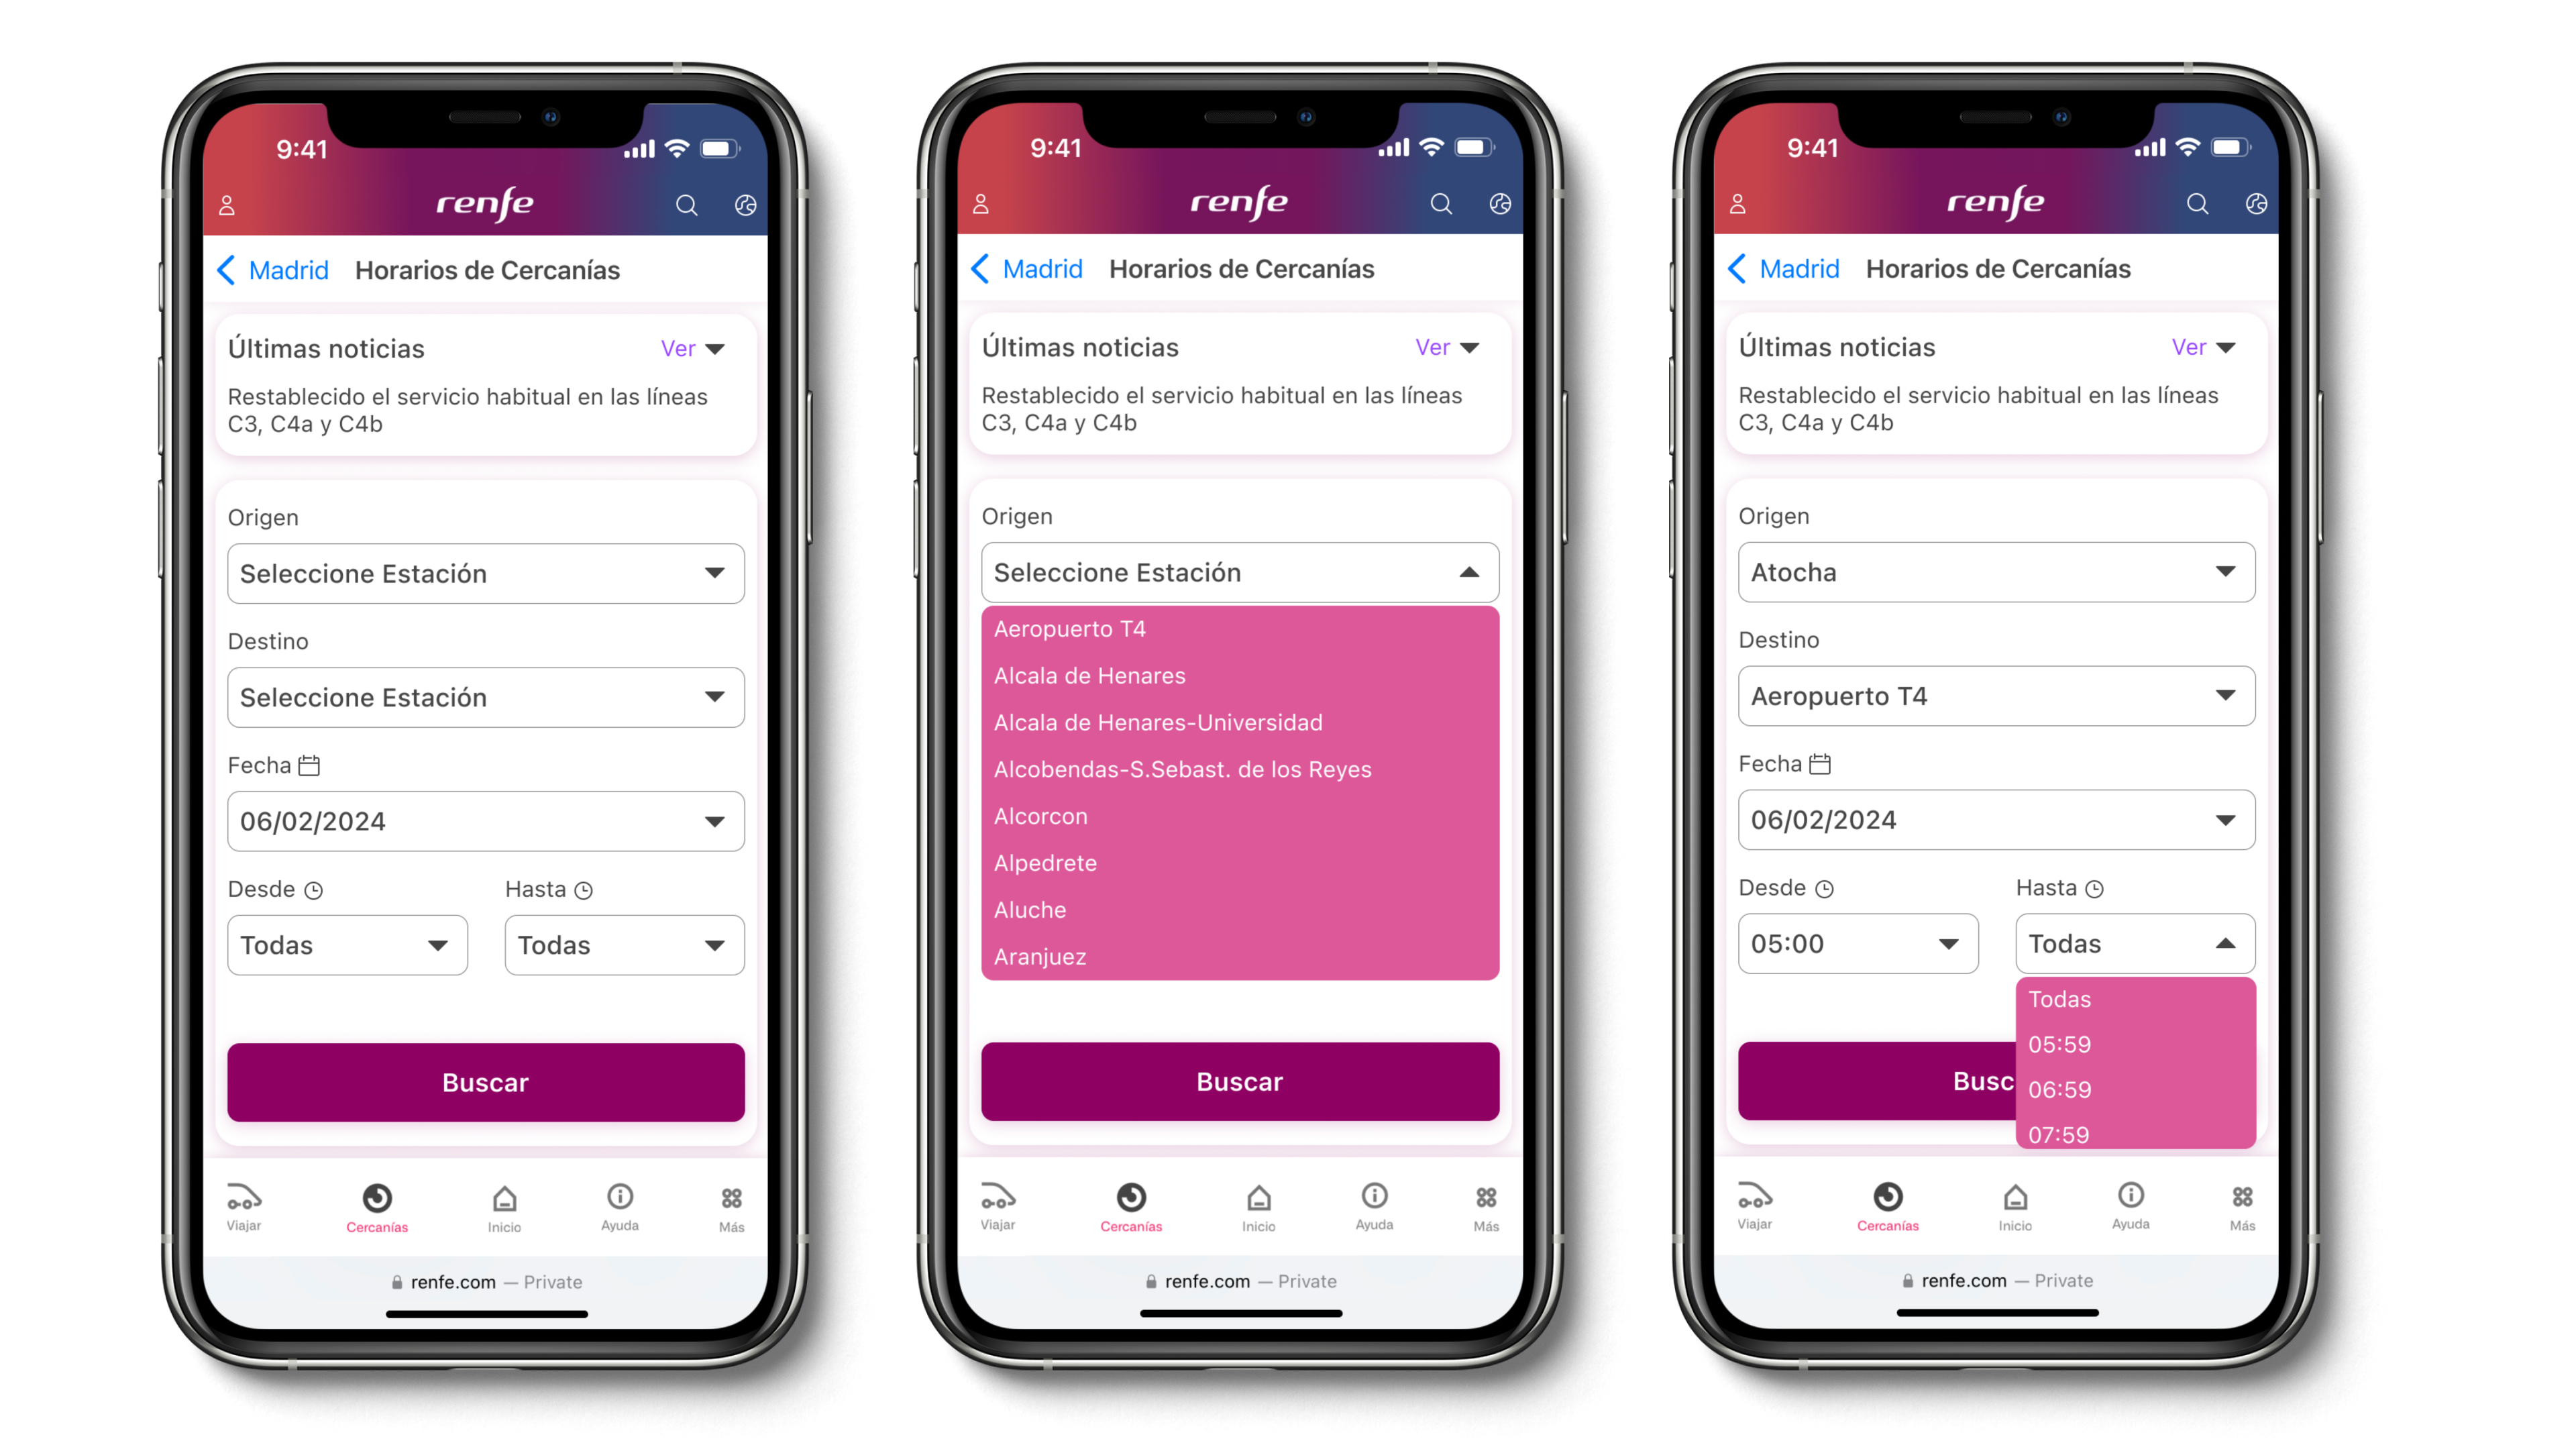
Users should carry out the task "search for trains from Atocha to Aeropuerto T4 for February 6th between 05:00 am and 08:59 am and in the result invert the origin and destination".
The main conclusions were the following:
Users had to scroll every time they wanted to search for a route because the "news" took up so much space on the screen.
The main button is lost in user visibility and lack of consistency.
It is not intuitively visualized that you have the possibility to invert the origin and destination.
The information of the trains is shown in a very unclear way, it does not have a fixed header so that the user does not know which column it is and its meaning.
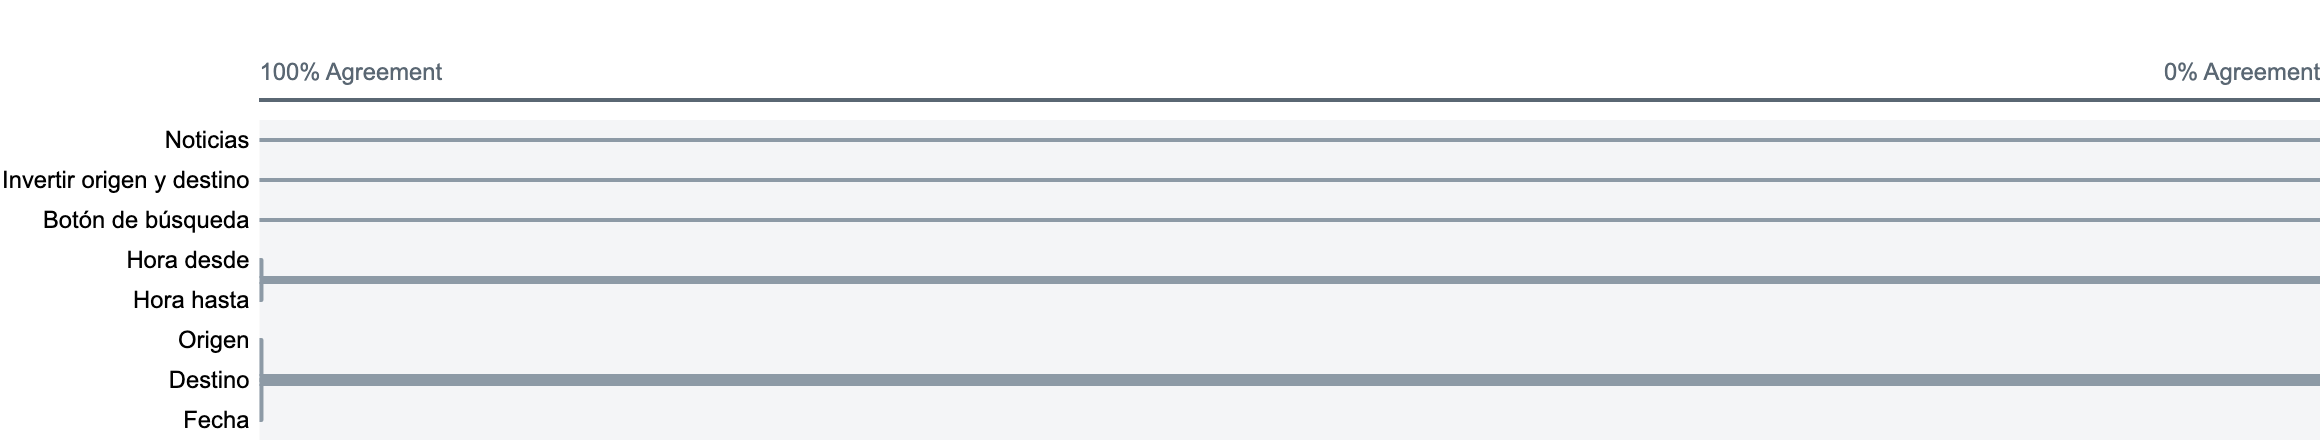
In the home page of the Renfe website there are a lot of elements, therefore, I have made an open Card Sorting with the 8 main elements that appear in the Renfe timetable search engine.
The test consists of the users sorting the 8 cards according to their criteria. The sample size this time is 8 people.
The sample is different from the one used for the interviews and the user test. This avoids any possible conditioning.
The objective is none other than to be able to reduce the number of elements. Grouping them into broader categories.
The tool used was Optimalworkshop.com.
In this third level of research I draw on my experience as a practitioner and my theoretical knowledge to apply a heuristic evaluation.
Fitt's Law: The search button is located too far away from the user's natural flow within the search engine section. The different categories are too grouped or saturated. In addition, for important actions such as consulting the schedules, the user has to scroll, otherwise he/she would not find these options.
Hick's Law: Renfe's website totally violates this principle. For the user, whose main objective is to search for train schedules, is exposed to an excessive amount of information. At a general level and also at a particular level. For only in the search area the user does not easily find its main purpose (the search engine).
Prägnanz's Law: This law is mainly violated with regard to icons and visual elements. They lack simplicity. The purpose of using visual elements is to make navigation easier and to quickly identify processes. When the opposite result is obtained, we have a problem.
Law of proximity: In this section of the Renfe website all the elements are grouped and separated without coherence. We tend to perceive the nearby elements as a unit. And that makes us think that they are related to each other.
My goal was to provide solutions to the problems listed above. These are the solutions applied
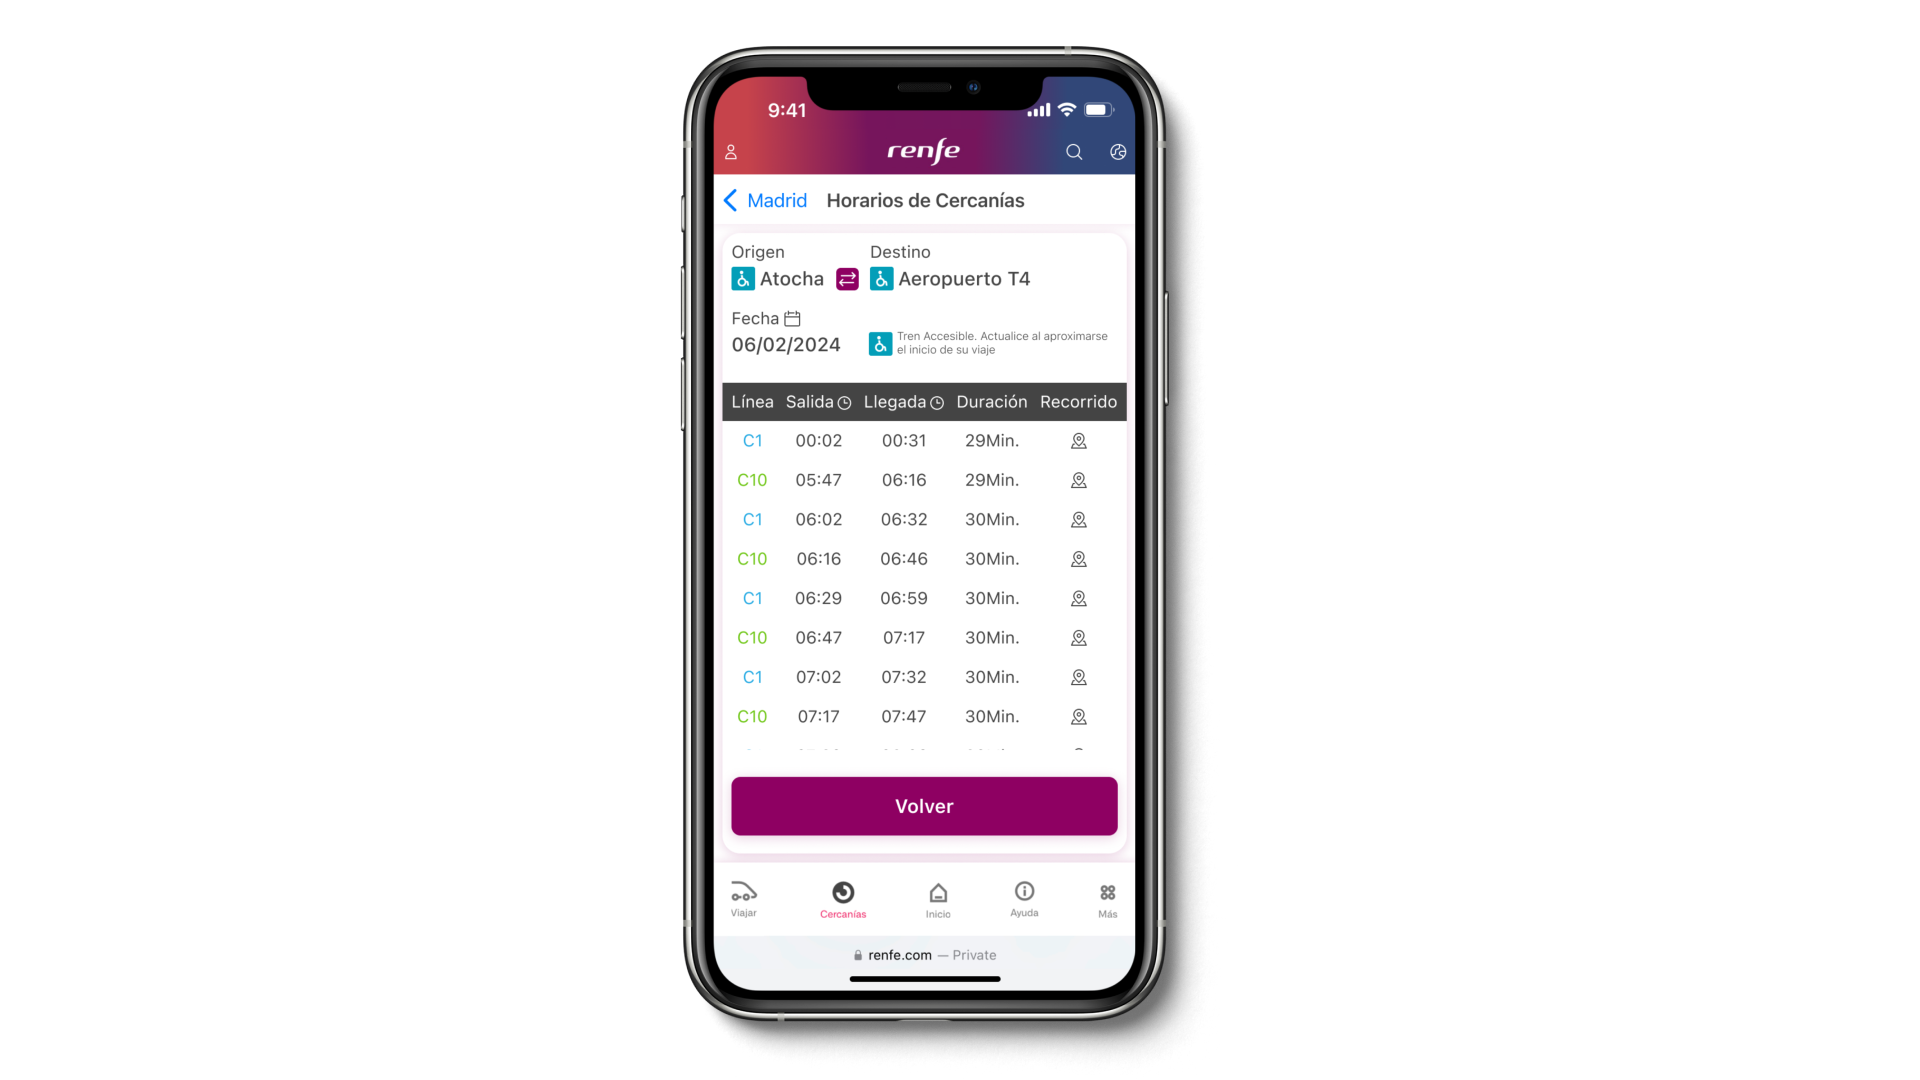
We can see that all the necessary information is always visible, and that the main button has coherence and consistency.
Also the news information related to commuter news is a drop-down, although important data will always be observed.
The route information is clearer, it is easy to reverse the origin and destination.
The train information will always have a fixed header while the train data is in a scroll-bar, so the user always knows what each column consists of.